SpendVerse: Media Spend Optimization and ROAS Tracking for FMCG Brands in India — Marketing Mix Modeling, Cross-Channel ROAS, Share of Voice Tracking, and Spend Forecasting with Maxx-RoI by KiEverse
Maxx-RoI
Extract Non-Linear ROAS from every penny spent
Campaign Name Generator
Campaign Level
New Campaign Month
Platform Specs
Brand Specs
Campaign Specs
TG Specs
Selected Campaign Details: None
Adset Level
TG Specs
Platform Specs
Brand Specs
Campaign Specs 1
Campaign Specs 2
Selected adset Details: None
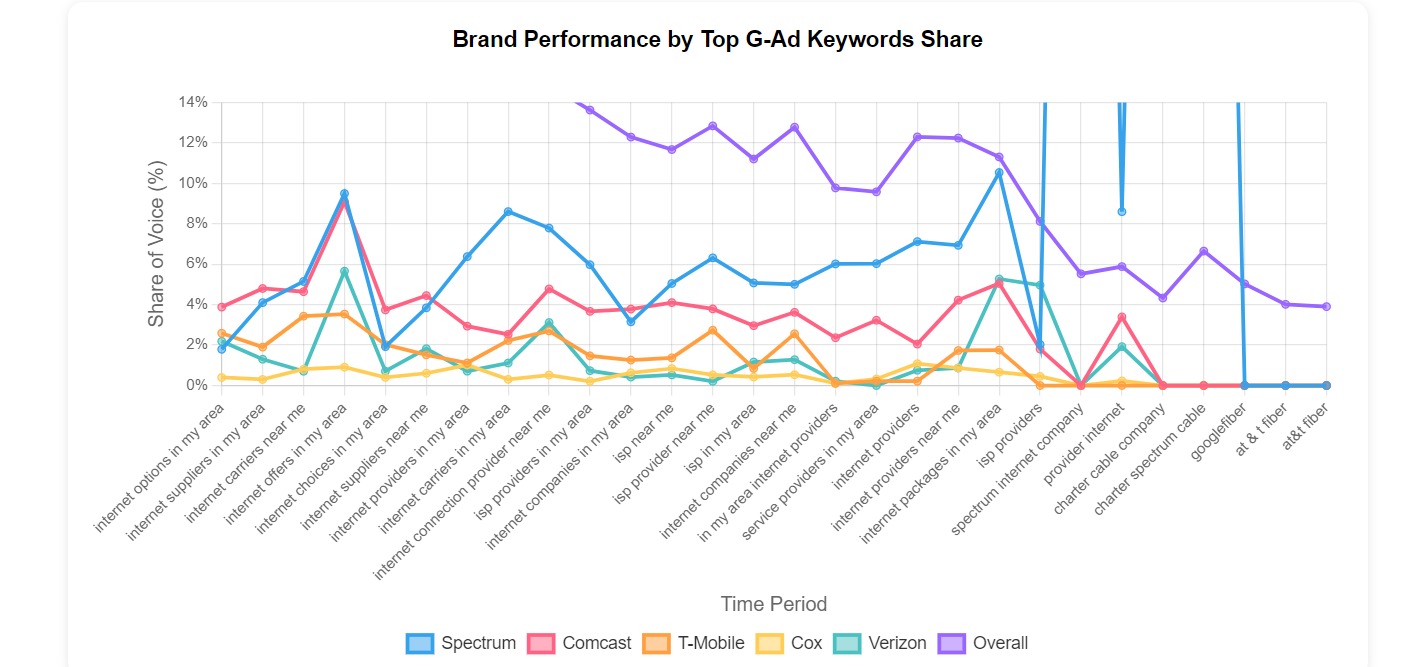
SOV Tool
Core Vs Non Core Paid SOV
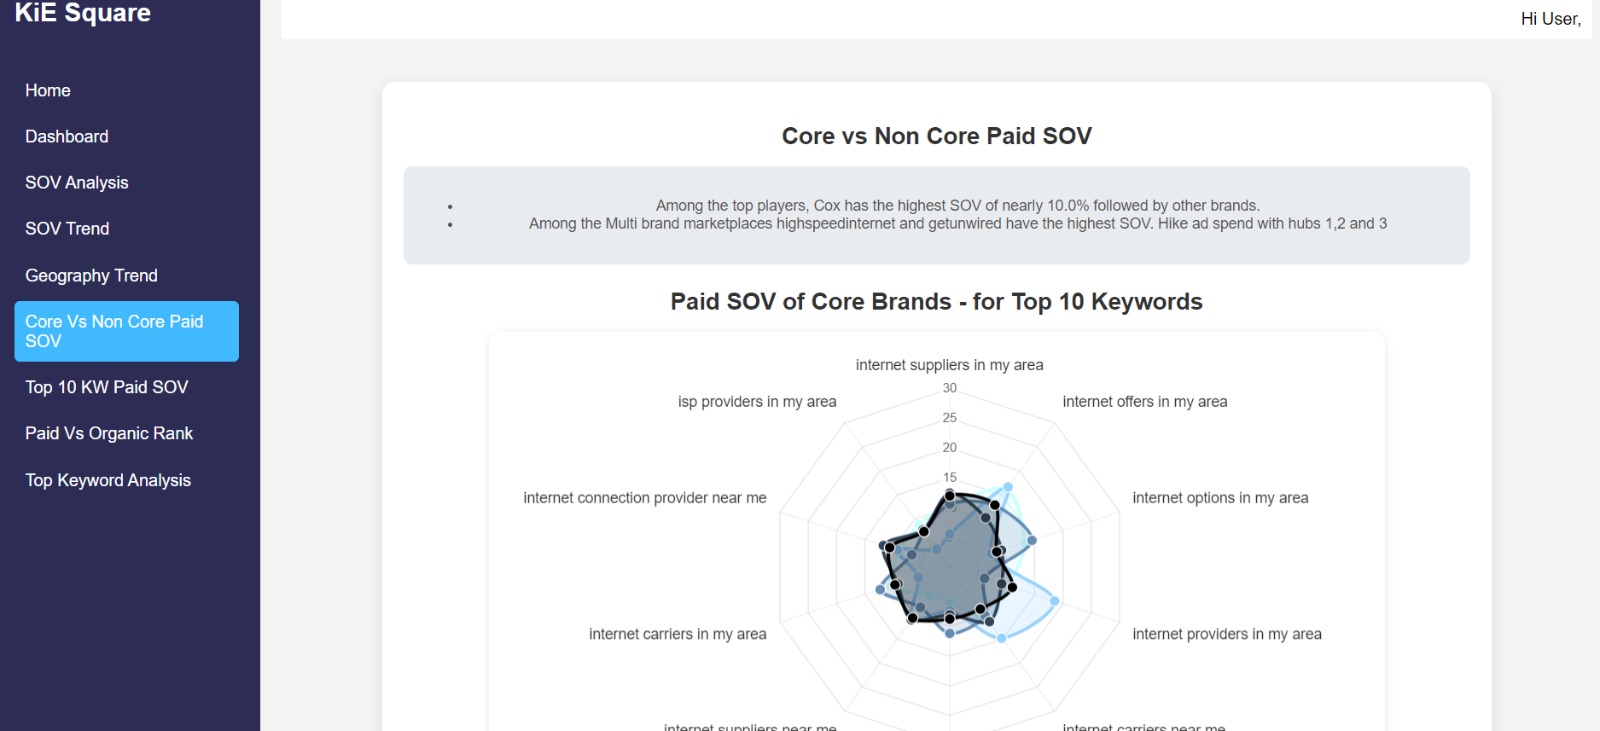
SOV Trend
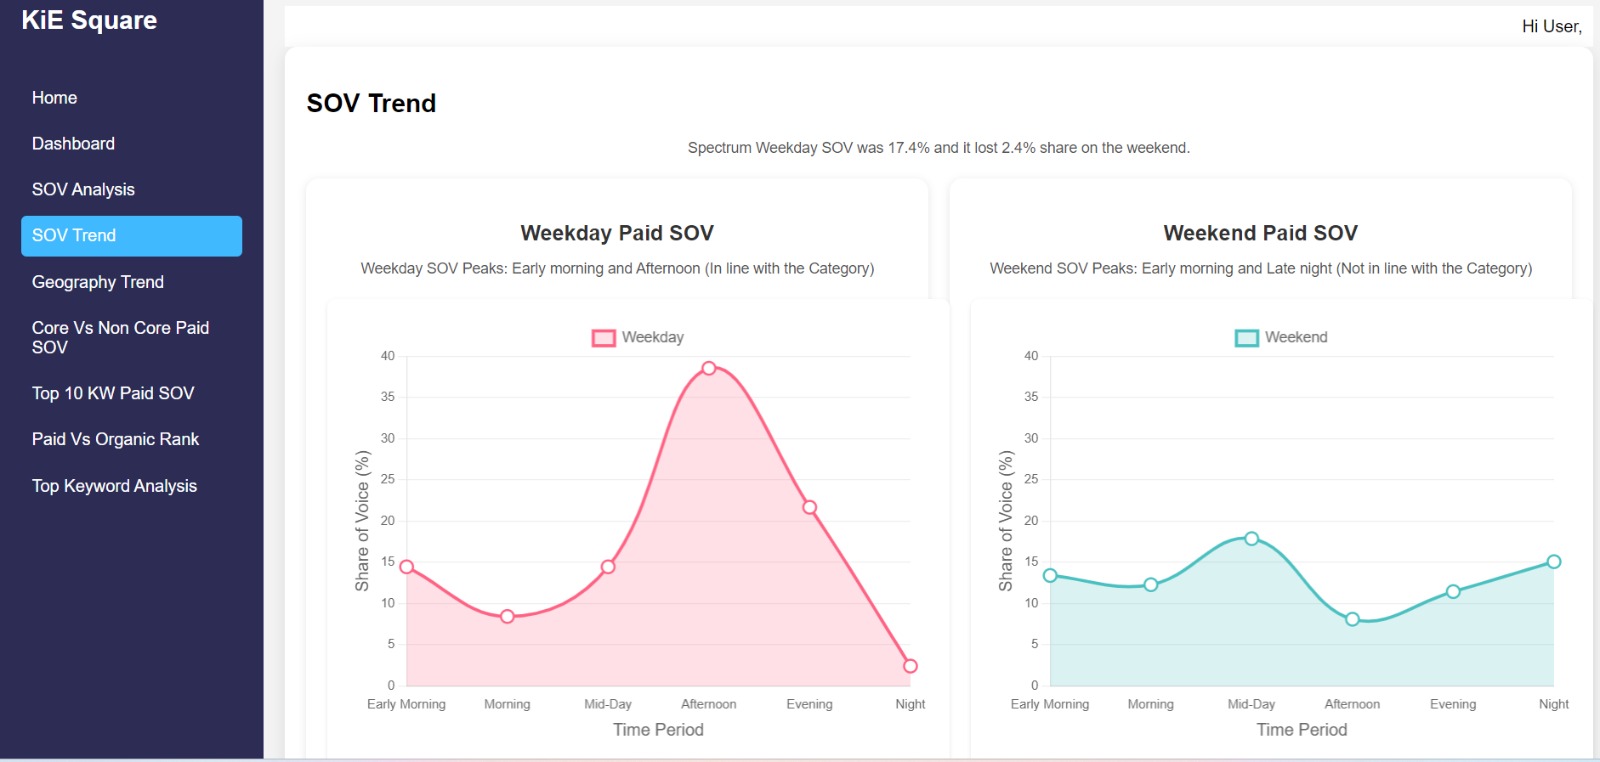
Keyword Analysis
Multi Channel Attribution / MMM
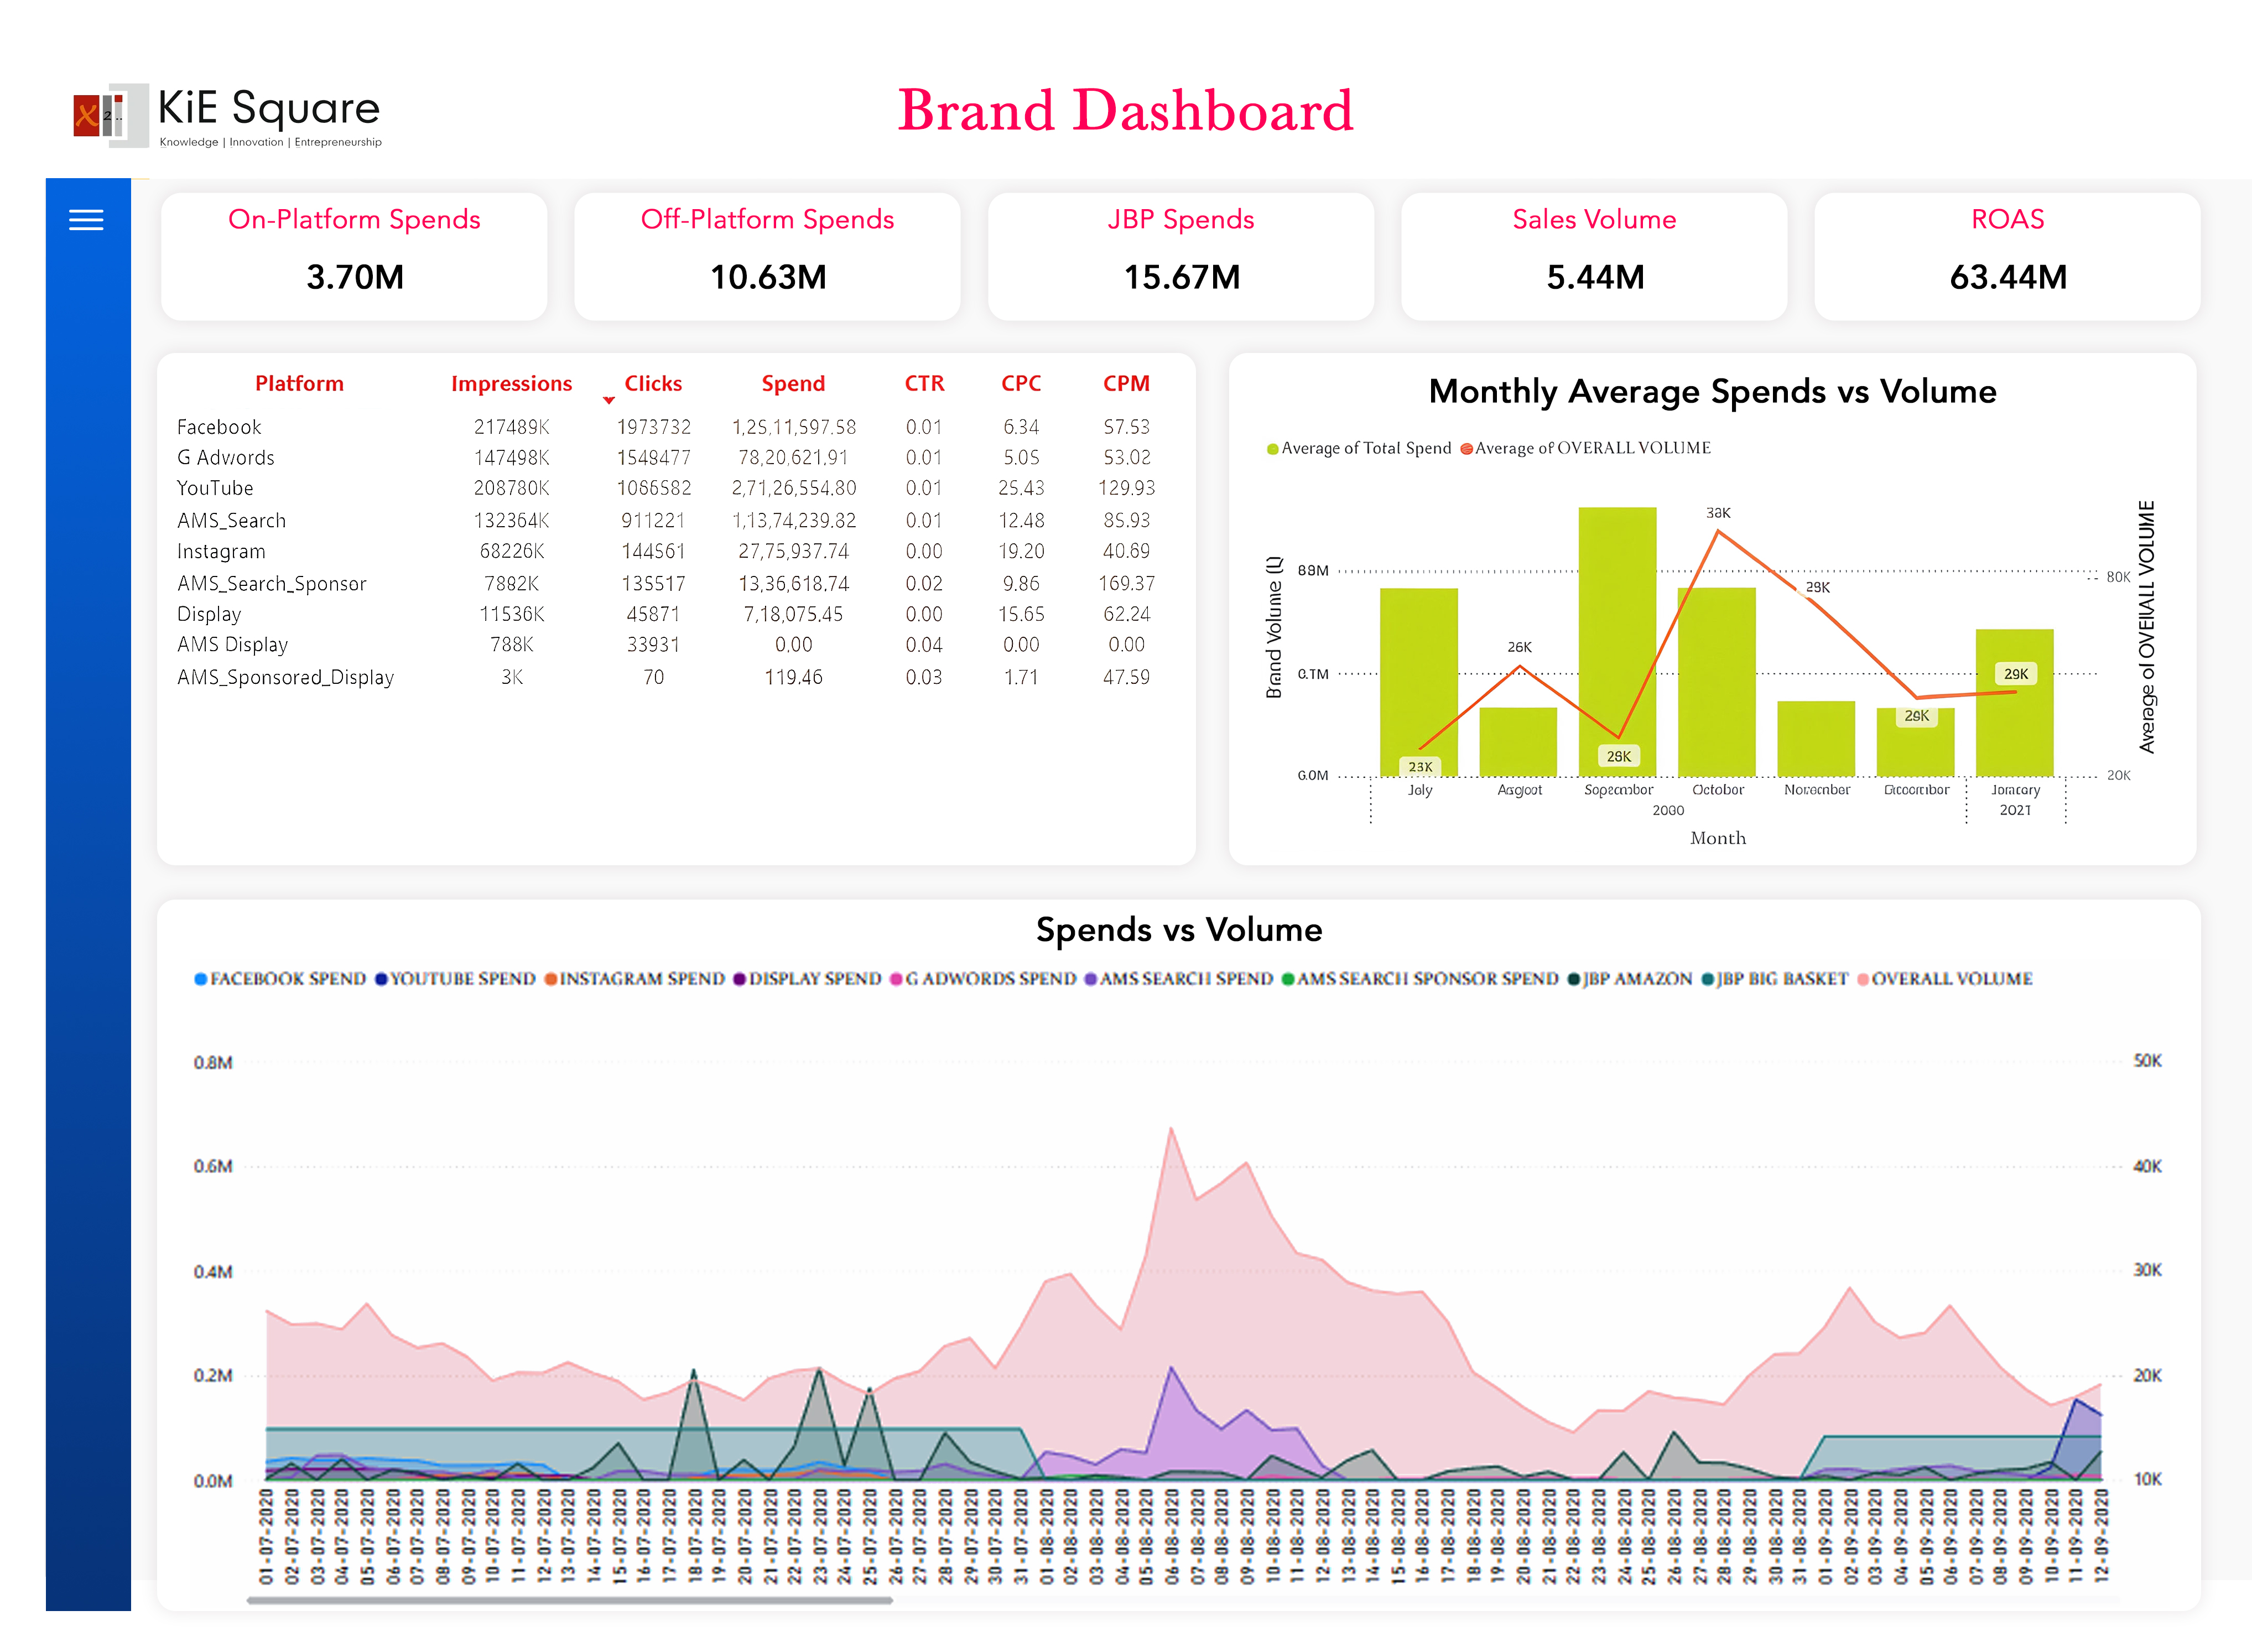

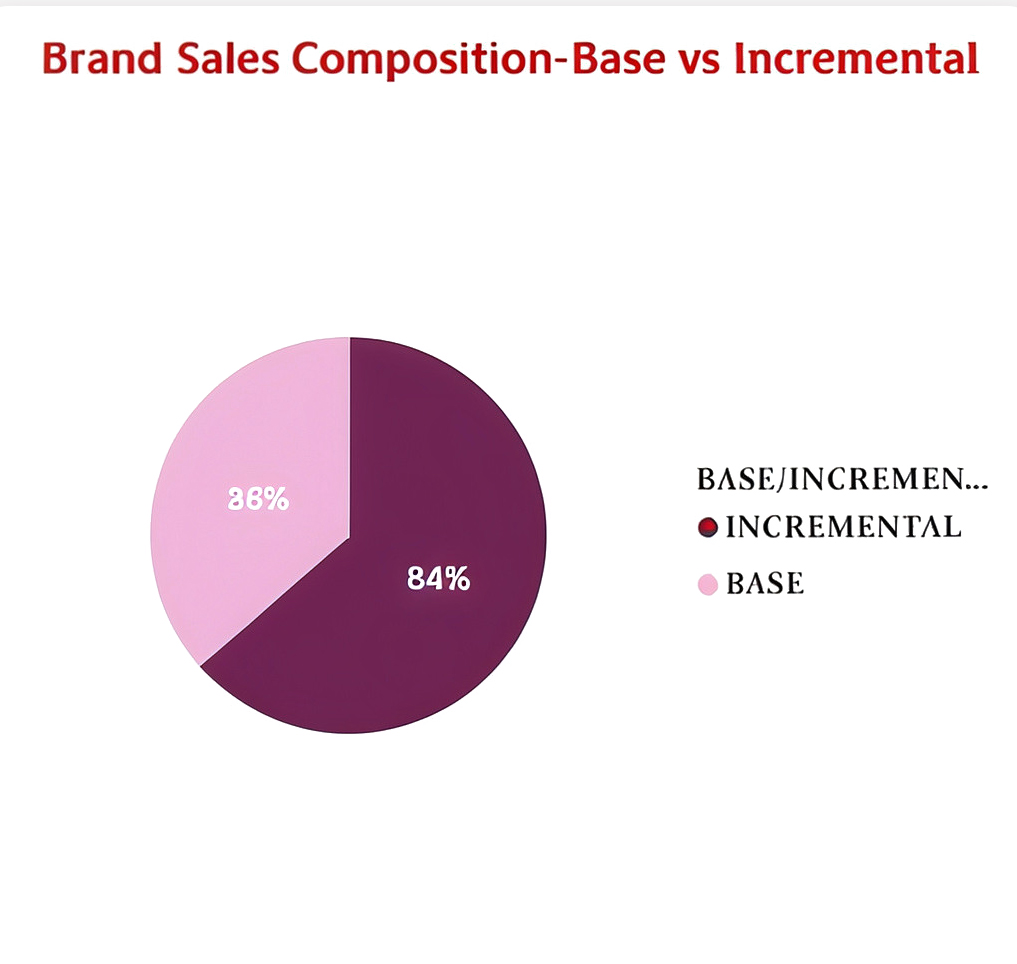
Visualize Investment Impact
This section showcases brand performance across
platforms, aligning spend with sales volume. With
granular breakdowns by channel, marketers can
pinpoint which investments are paying off and
which need adjustment enabling smarter budget
planning and channel prioritization.
- The marketing mix modeling dashboards are designed to provide a comprehensive analysis of brand performance across various platforms.
- These dashboards present detailed information on brand spend and volume across different channels, enabling marketers to understand how their investments correlate with outcomes.
- By visualizing the data, users can easily track the impact of their marketing activities and identify which platforms yield the highest returns.
- This holistic view of spend allocation helps in optimizing the marketing budget and making informed decisions that drive better business outcomes.
Measure Returns, Optimize Responsiveness
Dive deeper into your marketing efficiency with
ROI and elasticity insights. Understand which
channels drive the highest returns and how
sensitive sales are to changes in spend helping
you scale high-performing activities and adjust
quickly to market shifts.
- In addition to spend and volume insights, the dashboards include ROI charts that highlight the return on investment for each marketing channel.
- These charts help users assess the efficiency of their marketing strategies by showing which channels deliver the most significant returns relative to the investment made.
- Elasticity information is also featured, providing insights into how changes in marketing spend affect sales volume.
- Understanding these dynamics allows brands to fine-tune their strategies and respond more effectively to market conditions.


- The dashboards also incorporate data on discounts and volume, offering a clear view of how promotional activities influence sales.
- By analyzing this data, marketers can determine the optimal discount levels that maximize volume without eroding profitability.
- Overall, these dashboards serve as powerful tools for brands to assess and refine their marketing mix, ensuring that their strategies are both effective and efficient in driving growth.
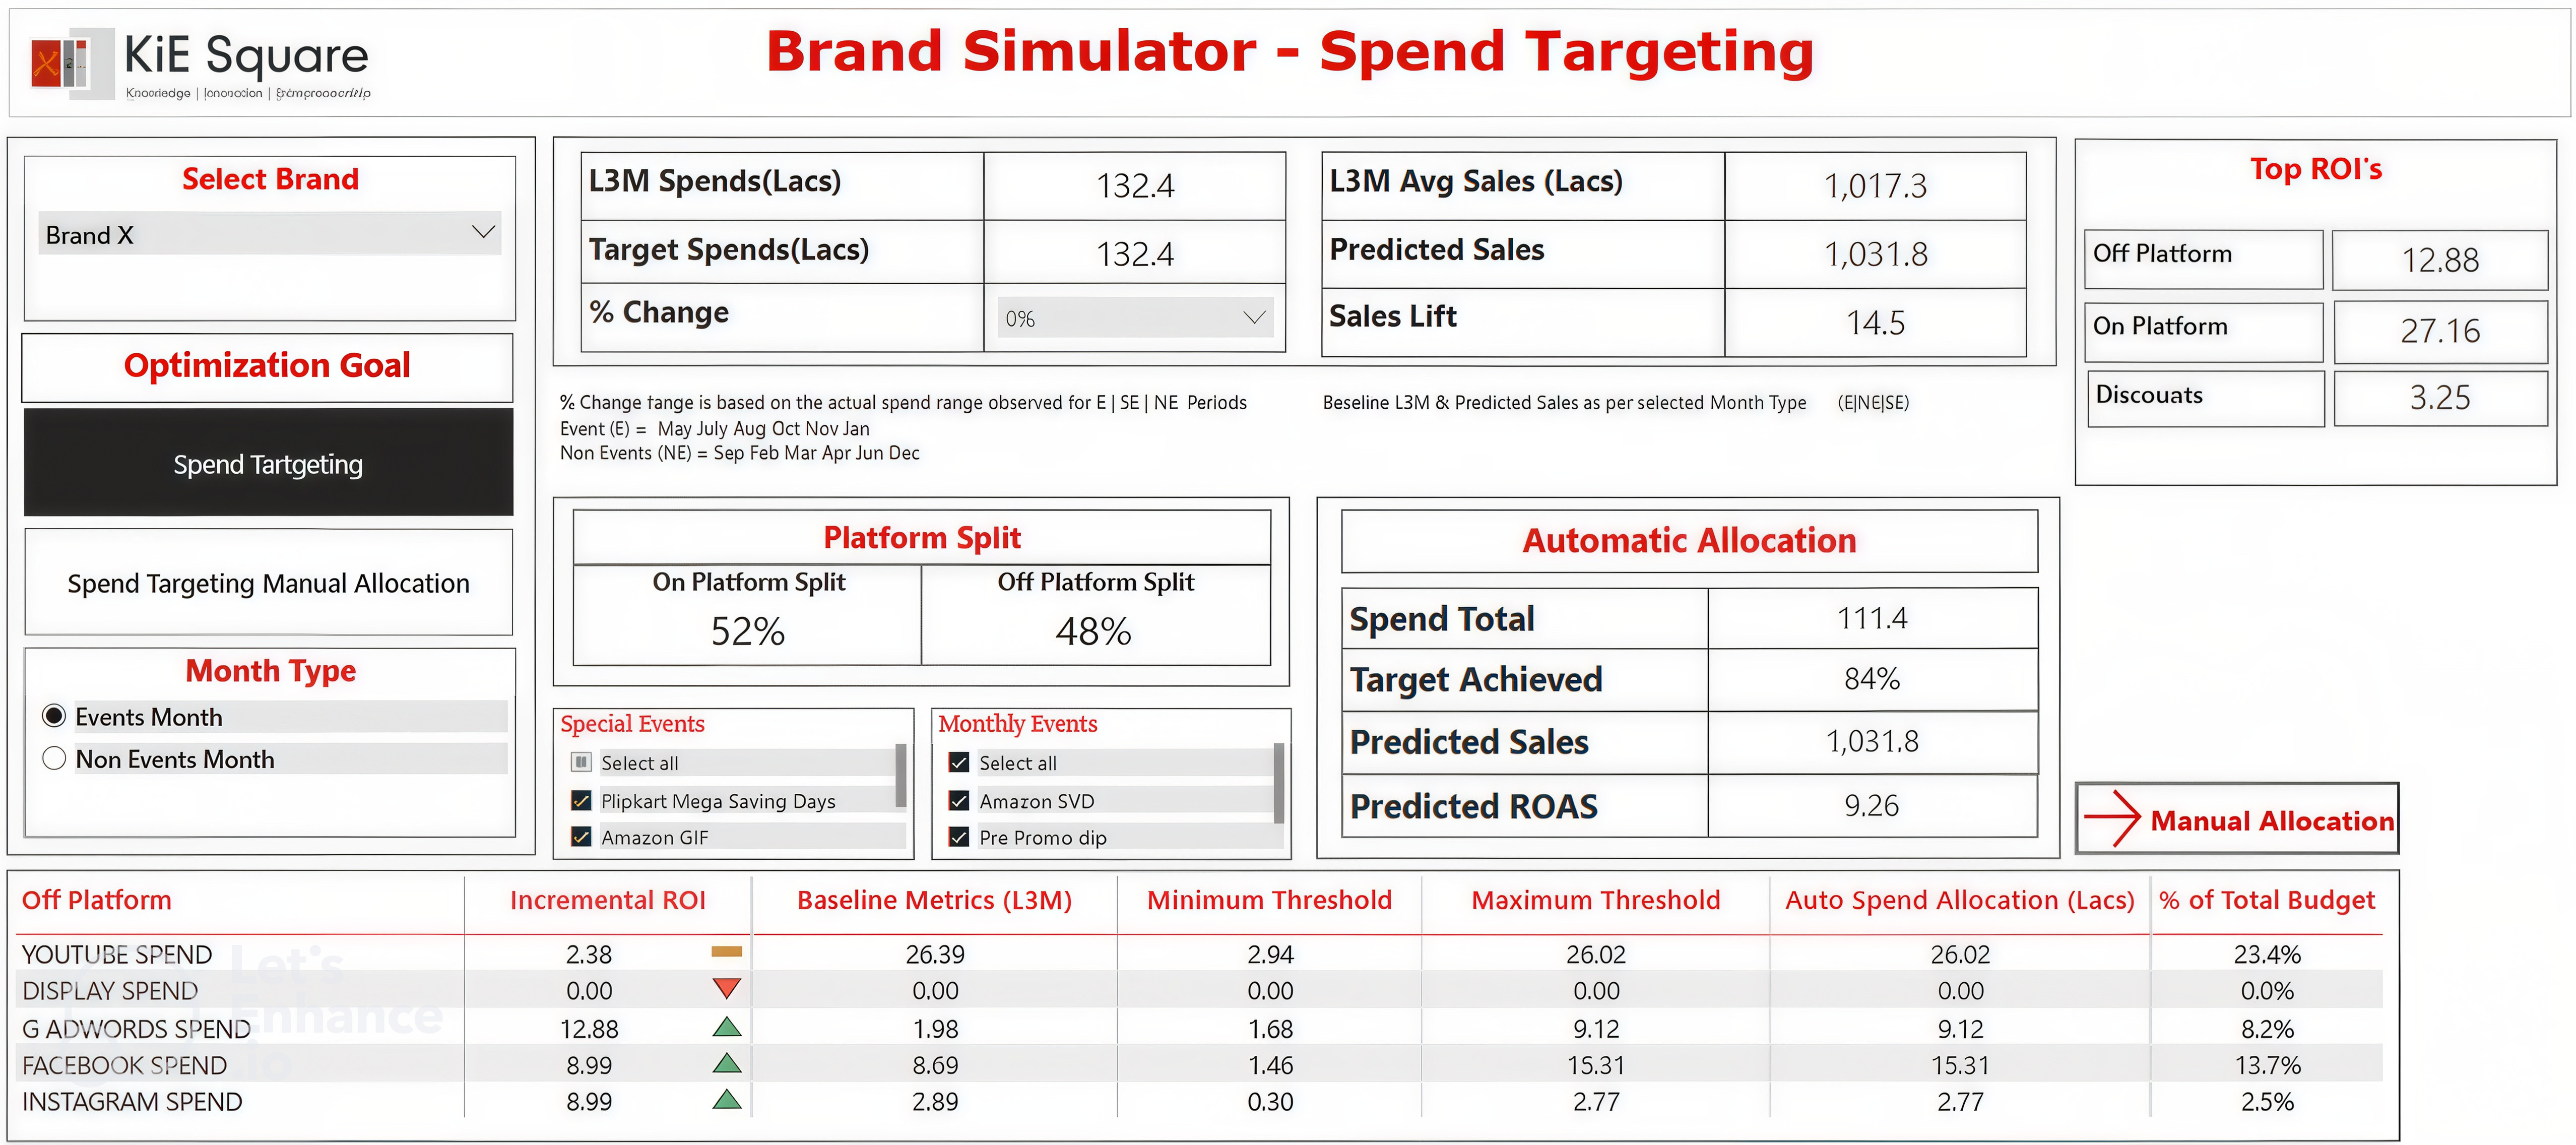
Simulator - Spend & Sales Forecast Tool
In a world where financial precision drives success, let the Simulator guide your path. Optimize your spend and sales forecasts with confidence and precision.
Product Overview
Achieving financial excellence goes beyond guesswork,
it requires strategy and accurate data. The Simulator,
powered by PowerBI, offers precise sales and spend
forecasts. Using a predefined model, it analyzes both
event and non-event months, leveraging historical data
to provide valuable insights for smarter budgeting and
optimized spending.
Unlock the full potential of your budget. Use the Simulator to achieve precise forecasts and strategic financial planning.
360 Marketing ROI:

Advanced Forecasting:
Strategic Budget Planning:
Intuitive Interface:

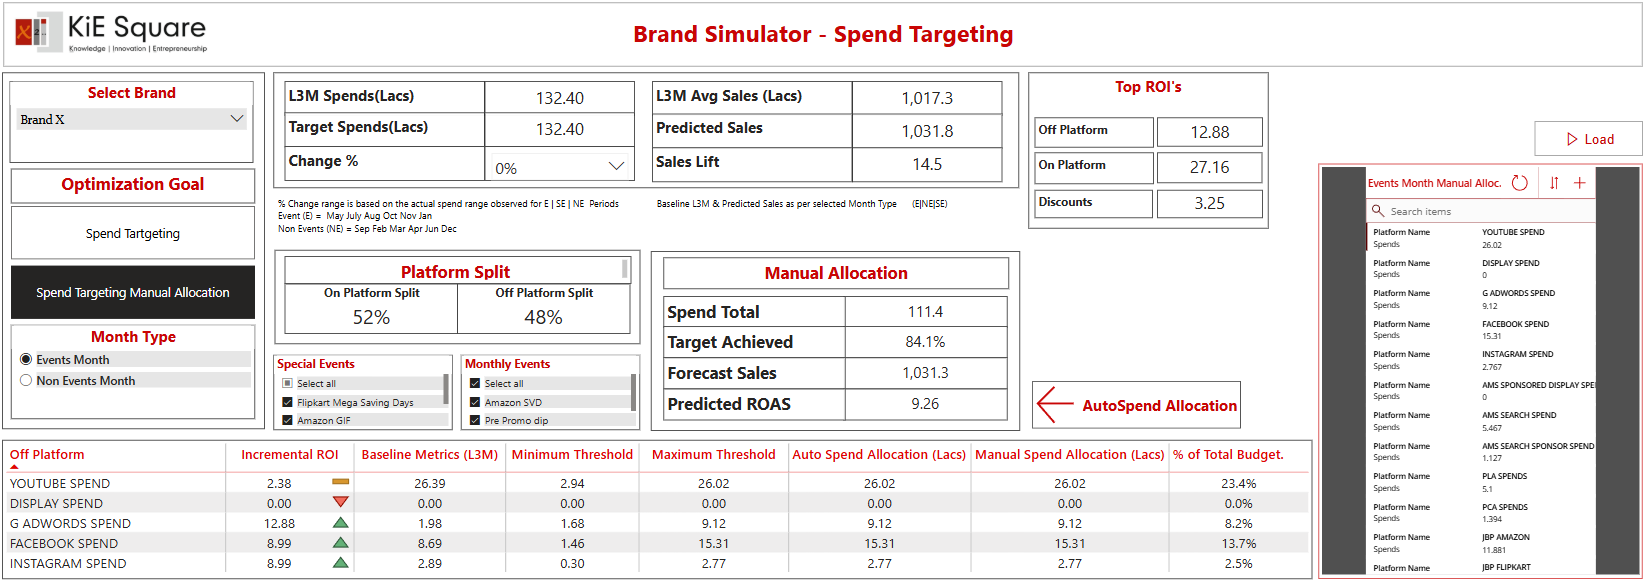
Why Choose the Simulator?

The Simulator is more than a forecasting tool; it's
your partner in strategic financial planning. By
integrating historical data with advanced
forecasting techniques, it provides you with
accurate, actionable insights to optimize your
budget and enhance ROI across platforms.
Forecast effectively, plan strategically—leverage the Simulator to navigate your financial journey with precision.
Ad Performance Insights
Optimize ACoS with granular PPC analytics
Marketplace Platforms Pay-per-click (PPC) advertising is a powerful growth lever. Our analytics provide deep visibility into your ad spend profile across:
ASIN Brands
Performance by product tier
Campaign Types
Sponsored Products, Brands, Display
Placement Types
Top of search, product pages, rest of search
Keyword
Types
Broad, phrase, exact match
Advanced Dayparting
Optimize ads by time of day for maximum impact
Data Integration → Business Impact
Ad Spend + Total Sales
Track trend alignment and efficiency
Inventory + Ad Performance
Prevent ad spend on out-of-stock items
TACoS + Net Profit
Measure true profitability
×
![]()